Home Search Reference Manuals Return Track Group Documentation
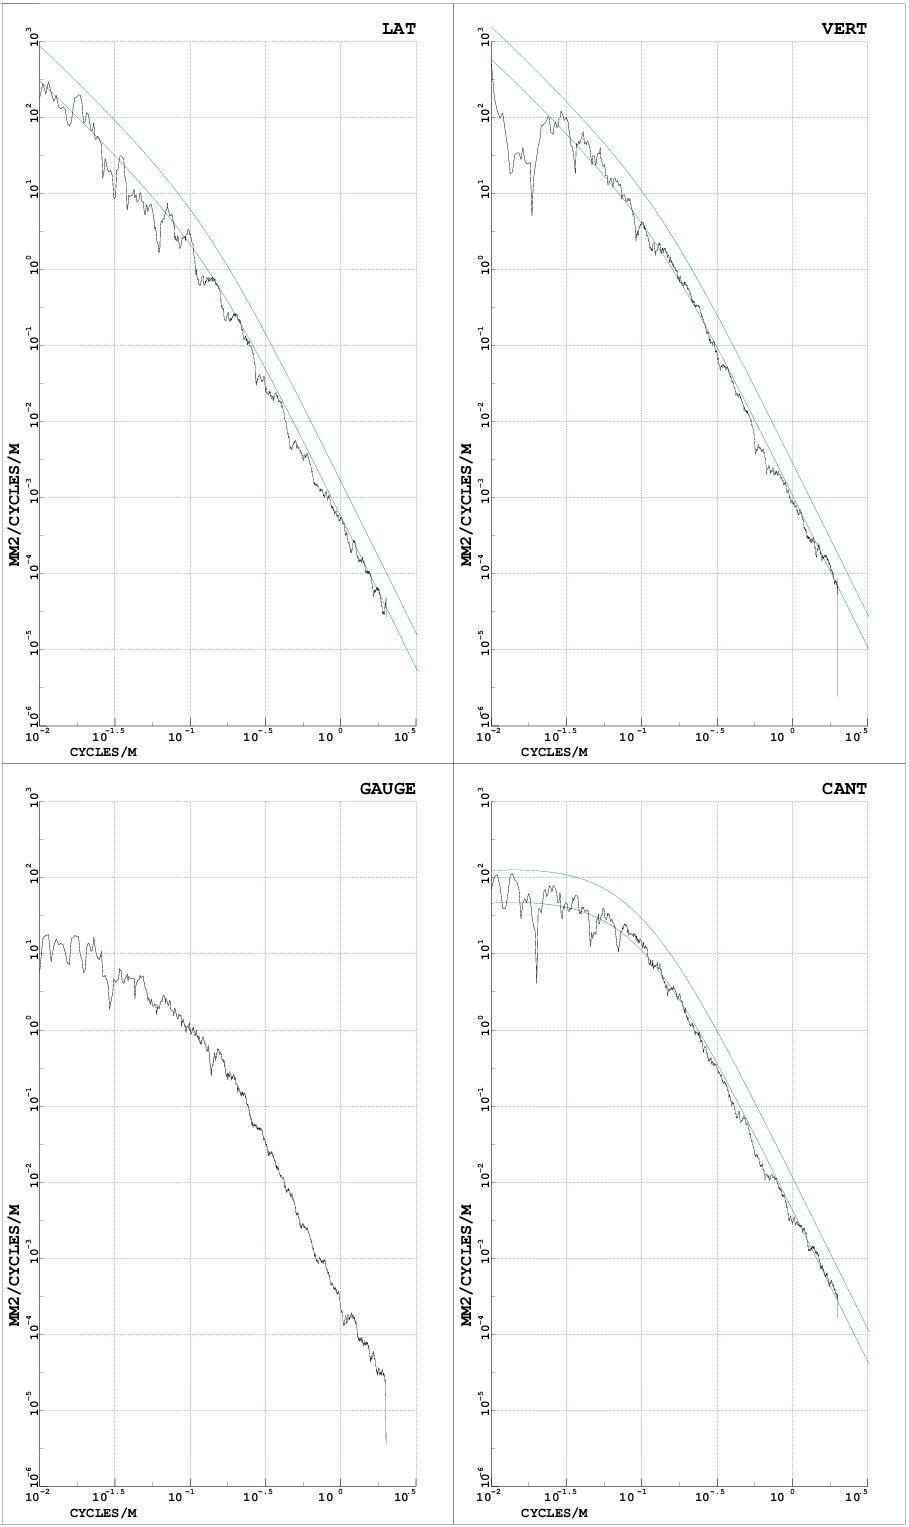
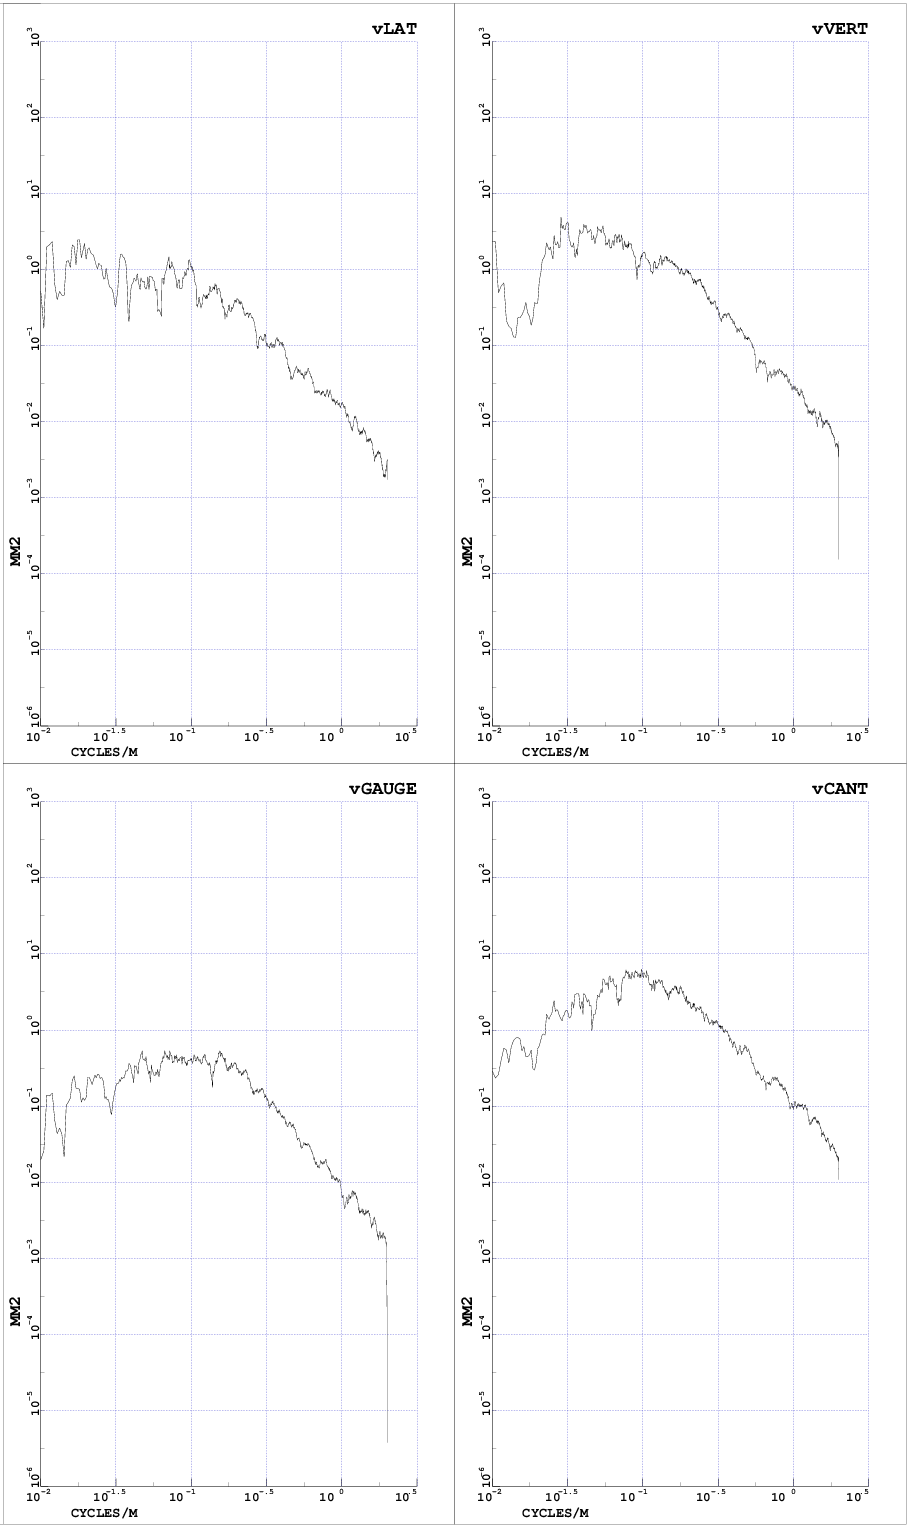
Program TRC_PSDPL plots the PSD spectra of a track.
Read the input data file and if the distance between two consecutive points in longitudinal direction are bigger than 0.5 [m], program TRC_PSDPL will spline interpolate more points in file INFIL. The PSD-spectra is obtained by calculating the Fourier-spectra of the autocorrelation spectra of the signal. After the PSD-spectra has been calculated it will pass a Hanning window, in order to make it smoother.
Input data is read in free format, valid separators between the input values are <space>, <comma>, <tab>, <equal sign> or <carriage return>. The commands can be written both in lower and upper case letters. The operation of the program is controlled by the commands described below; some of the commands also need arguments.
The output data consists of m-files and diagrams:
m-files written in directory PSDPLR_DIR are:
| PSD_GAUGE.m | = | PSD-spectra of the gauge irregularities | [mm2/(1/m)] |
| PSD_FI.m | = | PSD-spectra of the superelevation irregularities | [rad2/(1/m)] |
| PSD_LAT.m | = | PSD-spectra of the lateral Y-mid irregularities | [mm2/(1/m)] |
| PSD_VERT.m | = | PSD-spectra of the vertical Z-mid irregularities | [mm2/(1/m)] |
| vPSD_GAUGE.m | = | PSD-spectra of the derivatives of the gauge irregularities | [mm2] |
| vPSD_FI.m | = | PSD-spectra of the derivatives of the superelevation irregularities | [rad2] |
| vPSD_LAT.m | = | PSD-spectra of the derivatives of the lateral Y-mid irregularities | [mm2] |
| vPSD_VERT.m | = | PSD-spectra of the derivatives of the vertical Z-mid irregularities | [mm2] |
| aPSD_GAUGE.m | = | PSD-spectra of the second derivatives of the gauge irregularities | [mm2/m] |
| aPSD_FI.m | = | PSD-spectra of the second derivatives of the superelevation irregularities | [rad2/m] |
| aPSD_LAT.m | = | PSD-spectra of the second derivatives of the lateral Y-mid irregularities | [mm2/m] |
| aPSD_VERT.m | = | PSD-spectra of the second derivatives of the vertical Z-mid irregularities | [mm2/m] |
| Diagram #1 shows: | LAT | = | Lateral Y-mid irregularities | [mm2/(1/m)] |
| VERT | = | Vertical Z-mid irregularities | [mm2/(1/m)] | |
| GAUGE | = | Gauge irregularities | [mm2/(1/m)] | |
| CANT | = | Cant irregularities | [mm2/(1/m)] |

| Diagram #2 shows: | vLAT | = | First derivative of Lateral Y-mid irregularities | [mm2] |
| vVERT | = | First derivative of Vertical Z-mid irregularities | [mm2] | |
| vGAUGE | = | First derivative of Gauge irregularities | [mm2] | |
| vCANT | = | First derivative of Cant irregularities | [mm2] |

| Diagram #3 shows: | aLAT | = | Second derivative of Lateral Y-mid irregularities | [mm2/m] |
| aVERT | = | Second derivative of Vertical Z-mid irregularities | [mm2/m] | |
| aGAUGE | = | Second derivative of Gauge irregularities | [mm2/m] | |
| aCANT | = | Second derivative of Cant irregularities | [mm2/m] |

The units in the diagrams above depends on the units used in INFIL. In track formats trac, trax or trax_wdesign the units of the irregularities are in [mm].
Following example: Master.trc_psdplf can be used as a master file:
##
##    Input data file for program TRC_PSDPL
##

  PSD_METHOD= FOUR   XRAMP= 100
  PRINT_PSD = yes

  IDENT= 'track/Cst-G_293-294.trax_wdesign'
  INFIL=  track/Cst-G_293-294.trax_wdesign

  XSTART= 0       XSTOP= 1.e20


##
## Plotting data
## ----------------
  PAPER_FORMAT= a3p
  LXCM= 10         LYCM= 18
  X_LEFT= 1e-2     XCMPDEC= 4
  Y_BOT = 1e-6     YCMPDEC= 2

  SMOOTH = 1


  ILASER= 9        POSTFI= diags/trc_psdpl.pdf